18. Matplotlib 示例
Matplotlib 示例
以下是使用 Matplotlib 创建的类型和质量图。正如你所看到的,Matplotlib 可以让我们对可视化操作有更多的可控性。
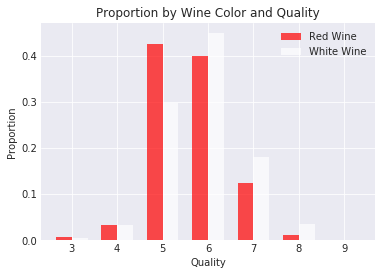
在开始此图的绘制之前,我们来看使用 Matplotlib 创建条形图的一个简单示例。我们可以使用 pyplot 的 bar 函数。
提示:不同页面上的workspace是不相连接的。为了保证代码的正常运行,有时候需要同学们点击左上角的jupyter按钮,将上一个workspace中的数据下载,并上传upload到另外的workspace中。
Workspace
This section contains either a workspace (it can be a Jupyter Notebook workspace or an online code editor work space, etc.) and it cannot be automatically downloaded to be generated here. Please access the classroom with your account and manually download the workspace to your local machine. Note that for some courses, Udacity upload the workspace files onto https://github.com/udacity , so you may be able to download them there.
Workspace Information:
- Default file path:
- Workspace type: jupyter
- Opened files (when workspace is loaded): n/a